Amino acid exchangeability: condensing data from mutation-scanning experiments
I just had to post the image below because it’s so cool.
Here’s the backstory. A decade ago, Lev Yampolsky and I did a meta-analysis of mutation-scanning experiments– studies that systematically change amino acids in proteins, and measure the effects. Based on about 10,000 experimental exchanges, we computed an “EX” measure of mean exchangeability for use in modeling evolution, and showed its superiority. In negative reviews of the paper, we were told that EX could not be relevant to biology or evolution because it was based on laboratory experiments that are artificial and detached from what happens in the real world.
Ultimately we won this argument because facts are more compelling than hand-waving arguments about what is realistic. We compared EX against other allegedly more reality-based measures (e.g., BLOSUM, Grantham, PAM, etc) for (1) predicting effects of mutation experiments (in a cross-validation), (2) predicting which types of replacements are most likely to be involved in Mendelian diseases, and (3) serving as a basis function (in PAML) for evolutionary acceptability. EX beat all the other measures in the first 2 tests, and tied with BLOSUM in the 3rd test.
Over the past few years, mutation-scanning experiments based on high-throughput methods have exploded. In particular, it is possible to engineer huge numbers of genetic variants– e.g., creating every possible single amino acid change in a protein– express the variants in a mixed culture where growth is dependent on the mutated gene, and sequence the whole mess, assigning fitness based on relative frequency.
Over the past few months I have been processing data from these experiments. The data have many uses, but one of them is to compute a new measure of exchangeability. The first version of EX presented point estimates of exchangeability for each (asymmetric) path from amino acid 1 to amino acid 2, e.g., Alanine to Valine. That is, each EX value was a single number.
Now we have so much data that it is possible to present, for each amino acid replacement, a distribution of effects. That is what is shown in this figure (click exd for a PDF with full resolution). The data are ~100K exchanges from ~30 experiments. For each histogram, the x axis is quantile from 0 to 1 and the y axis is density. Each bar is ~25 observations on average. The amino acids are sorted chemically. Red is hydrophilic-hydrophilic, blue is hydrophobic-hydrophobic, and purple is mixed.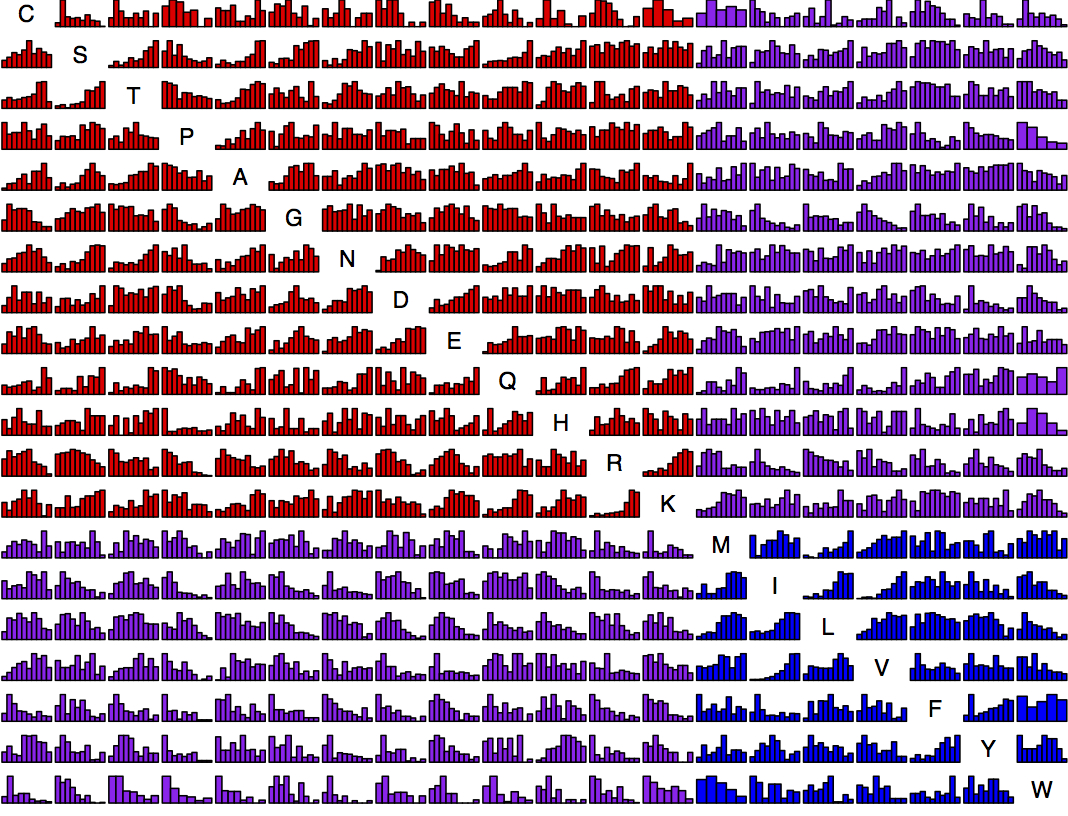
This is asymmetric. The row is “from” and the column is “to”. For instance, exchangeability from Lysine tends to be high consistently because the majority of Lysine residues are found at surface positions, which are more forgiving. So the row for Lysine has a lot of increasing histograms, while the column has quite a few decreasing ones. For instance, K —> M is quite different from M —> K.