The range of rates for different genetic types of mutations
To understand the potential role of mutation in evolution, it is important to understand the enormous range of rates for different types of mutations. If one ignores this, and thinks of “the mutation rate” as a single number, or if one divides mutation into point mutations with a characteristic rate, and other mutations that are ignored, one is going to miss out on how rates of mutation determine what kinds of changes are more or less common in evolution. It would be like allowing a concept of fitness, then subverting its utility by distinguishing only two values, viable and inviable. [1]
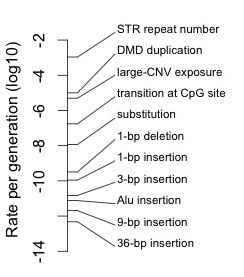
To illustrate this range concretely, I have collected some estimates and made a simple number line showing estimates of average rates for different classes of mutations in humans, spanning 10 orders of magnitude (there is a data table below, and an appendix with R code for making the number line).
For instance, short tandem repeats or STRs, like the repeats of CAG found in some genes, mutate at a rate of 1.2 X 10⁻³ per generation, with most mutations adding or subtracting a single repeat unit (Weber and Wong, 1993). Presumably the rates for some epigenetic mutations, like changes in methylation states, are even higher.
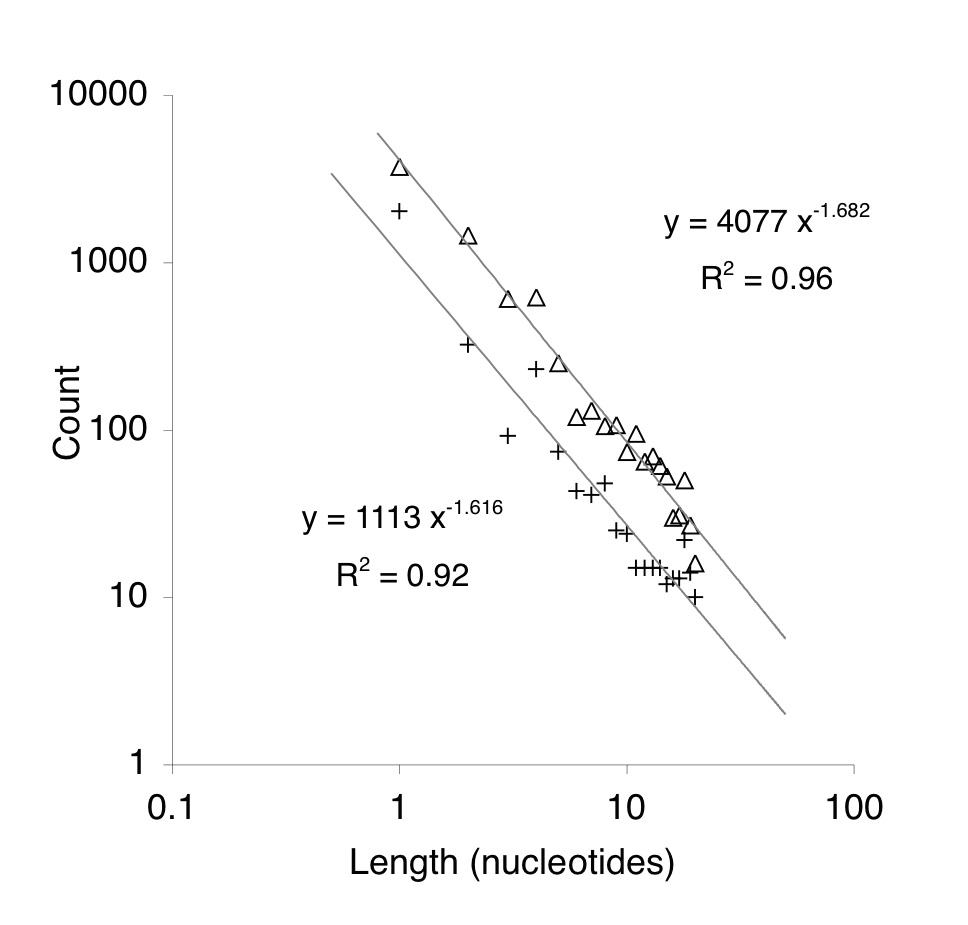
Indels accumulate in pseudogenes according to a negative power-law relationship, i.e., frequency is proportional to length raised to a negative power. Deletions (triangles) accumulate 4-fold faster than insertions (pluses), but the power-law relationship for both is similar.
The rates of small insertions and deletions (indels) are calculated from the power-law relationship in Lynch (2010). This is the same relationship shown in the figure below from Yampolsky and Stoltzfus (2008). Lynch also presents rates for substitutions.
I couldn’t find a good estimate for the average rate of per-locus duplications in humans. The rate of CNV (copy-number variation) exposure of 5 X 10⁻⁶ is the chance that a base-pair will be included in a large duplication, from Campell & Eichler. This per-bp rate will be less than the per-locus rate, but will be very close when loci are much smaller than duplications. The aggregate rate of duplications for the Duchenne muscular dystrophy (DMD) locus is 1 X 10⁻⁵ (van Ommen, 2005).
The appendix below has a table that explains the basis of each of these estimates (thanks to mattsbits and his text-to-html table generator, which is an easy way to make a clean HTML table from a csv or tsv text file).
There are 3 further things to note. First, these data are for a particular species of ape that is odd in many ways (e.g., hairless, bipedal, etc), but not particularly odd in showing a range of mutational rates. Presumably there is a huge range of mutation rates in every organism, though the details may differ [2]. We simply know a lot more about mutation rates in humans than in other species.
Second, note that the above number line could be extended downward arbitrarily far, to smaller and smaller rates, by invoking more complex mutations or combinations. For instance, a duplicated locus with a specific nucleotide mutation would be about 10-8 * 10-5 = 10-13. A duplicated locus with a nucleotide mutation and an STR mutation would be about 10-8 * 10-5 * 10-3 = 10-16.
Measuring such tiny rates directly is difficult. However, we cannot ignore complex mutations in evolution. For instance, we might be inclined to ignore double-substitution mutations on the grounds of having a rate of 10-16 per double mutation, but consider the following. A human has on the order of 100 new mutations. Assuming about 1/40th of mutations affect the coding or expression of a gene directly, a human has ~2.5 new mutations in genes. The chance that those 2.5 new mutations will be in the same gene, assuming 20000 genes and using the square approximation to the Birthday Problem, is 2.52 / (2 * 20000) = 1.6 X 10⁻⁴, which is 1 in 6400. Thus, although you might be inclined to ignore double mutations in a gene, chances are good that you went to university with someone who has one. In the current human population of 7 X 10⁹, there are about a million of these double mutants, or about 55 for every gene. We are over-flowing with new double mutants, even though the chance of any specific double mutation is vanishingly small.
Finally, note that the points on the number line are estimates of average rates (except for the DMD case, which is an aggregate rate for a specific locus). The rate of a specific nucleotide substitution is not always the average rate of 10-8, but may vary upwards or downwards by many-fold. If we break the substitutions down into 6 different paths regardless of strand (e.g., A–>T, C–>G, etc), then we’ll get 6 different rates. If we break them down further according to the local nucleotide context (the nucleotides upstream and downstream), we’ll get even more rates. Ultimately we can break them down into site-specific rates at single genomic sites, and no one really knows for sure what is the variability at that level, though there have been attempts such as that shown in the figure below from Michaelson, et al, 2012, which probably underestimates the variability for reasons pointed out by Eyre-Walker and Eyre-Walker. According to the latter, the coefficient of variation (the ratio of the standard deviation to the mean) is at least 1.1, but could be much higher (the region in the figure below seems to show a CV considerably less than 1.1). 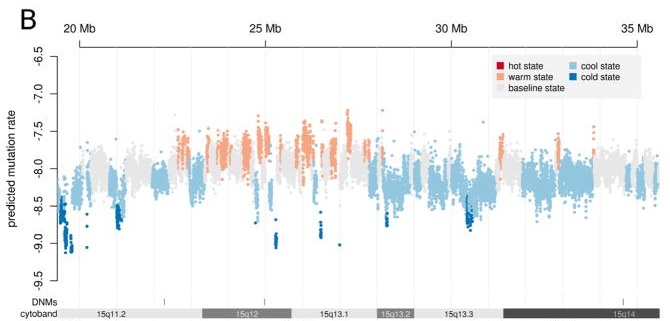
References
Campbell CD and Eichler EE. 2013. Properties and rates of germline mutations in humans. Trends Genet 29: 575-584. doi: 10.1016/j.tig.2013.04.005
Cordaux R, Hedges DJ, Herke SW and Batzer MA. 2006. Estimating the retrotransposition rate of human Alu elements. Gene 373: 134-137. doi: 10.1016/j.gene.2006.01.019
Lynch M. 2010. Rate, molecular spectrum, and consequences of human mutation. Proceedings of the National Academy of Sciences of the United States of America 107: 961-968. doi: 10.1073/pnas.0912629107
van Ommen GJ. 2005. Frequency of new copy number variation in humans. Nat Genet 37: 333-334. doi: 10.1038/ng0405-333
Weber JL and Wong C. 1993. Mutation of human short tandem repeats. Hum Mol Genet 2: 1123-1128.
Yampolsky LY and Stoltzfus A. 2008. Mutational Bias. In. Encyclopedia of Life Sciences. Chichester: John Wiley & Sons.
R code
This is an experiment. I’m having some trouble getting my code formatter to work. Please read “<” as the “<” symbol.
# define a numberline function
# this function is from other code & could be modified to suit this purpose better
numberline_plot <- function(vals, labels, ylabel = "", date_unit, tick_ratio = 0.05, tail_ratio = 0.2, ax_expand = 0.15, log = FALSE) {
# sort the values and their labels
labels <- labels[order(vals, decreasing = TRUE)]
if (log) { vals <- log(vals, 10) }
vals <- sort(vals, decreasing = TRUE)
# compute a prettier scale, then get y values for the labels (leg_y)
jigger <- ax_expand * (max(vals) - min(vals))
new_range <- c(min(vals) - jigger, max(vals) + jigger)
spread = new_range[2] - new_range[1]
leg_y = seq(new_range[2], new_range[1], length.out = length(vals))
# make a blank plot field that will hold the legend and the number line
plot.new()
plot.window(new_range, new_range)
# add the axis; use dates if date_unit (year, month, day) is supplied
if (missing(date_unit)) {
axis(2, pos = new_range[1])
} else {
axis.Date(2, seq(new_range[1], new_range[2], by=date_unit), format="%Y", labels = TRUE)
}
mtext(ylabel, 2, line = 2)
# plot the legend (have to compute tick_x first)
tick_x <- new_range[1] + tick_ratio * spread
leg_x <- tick_x + tail_ratio * spread
text(leg_x, leg_y, labels = labels, adj = c(0,0), cex = 8/length(labels))
# plot the ticks
start <- new_range[1]
irrelevant_ret_val <- sapply(X=1:length(vals), function(x) lines(c(start, tick_x), y = c(vals[x], vals[x])))
# plot the tails
tail_x <- leg_x - spread/100 # just to add a bit of space
irrelevant_ret_val <- sapply(X=1:length(vals), function(x) lines(c(tick_x, tail_x), y = c(vals[x], leg_y[x])))
}
# read data. if "#" is in input field, need to re-specify comment.char to avoid it
infile <- "mut_rates.tsv"
mut_rates <- read.table(infile, header = T, sep = "\t", comment.char = "", stringsAsFactors = F)
# get rid of some points to make the lot look nicer
mut_rates <- mut_rates[ !(mut_rates$label == "3-bp deletion" | mut_rates$label == "9-bp deletion"), ]
numberline_plot(mut_rates$rate, mut_rates$label, ylabel = "Rate per generation (log10)", log = TRUE)
Data
Tab-separated values.
rate	label	description	comment	source
1.20E-03	STR repeat number	rate of repeat mutations	91% are single-repeat changes	Weber and Wong 1993
1.00E-05	DMD duplication	duplication of the Duchenne Muscular Dystrophy gene	this is a synthetic estimate based on data from refs 7 and 8 in source	van Ommen 2005
5.00E-06	large-CNV exposure	the rate at which a nucleotide is included in a duplication	mid-point of range estimate of 16kb to 50kb per birth, divided by diploid genome size	Campbell and Eichler 2013
1.74E-07	transition at CpG site	transition at CpG site is 15X the rate at other sites 	attributed in source to refs 8, 21	Lynch 2010
1.16E-08	substitution	base substitution average per site per generation for autosomal	p. 961	Lynch 2010
3.21E-10	1-bp deletion	a deletion of 1 bp	rate of all (length 1 to 50) dels from p. 963 multiplied by the expected fraction of length 1, which is 0.554 by the formula in Fig. 1. 	Lynch 2010
1.11E-10	1-bp insertion	an insertion of 1 bp	rate of all (length 1 to 50) ins from p. 963 multiplied by the expected fraction of length 1, which is 0.554 by the formula in Fig. 1. 	Lynch 2010
4.36E-11	3-bp deletion	a deletion of 3 bp	rate of all (length 1 to 50) dels from p. 963 multiplied by the expected fraction of length 3, which is 0.0751 by the formula in Fig. 1. 	Lynch 2010
1.50E-11	3-bp insertion	an insertion of 3 bp	rate of all (length 1 to 50) ins from p. 963 multiplied by the expected fraction of length 3, which is 0.0751 by the formula in Fig. 1. 	Lynch 2010
7.58E-12	Alu insertion	average rate of Alu insertion per bp per generation	assuming 2 * 3.3e9 base pairs in genome	Cordaux et al. 2006
5.92E-12	9-bp deletion	a deletion of 9 bp	rate of all (length 1 to 50) dels from p. 963 multiplied by the expected fraction of length 9, which is 0.0102 by the formula in Fig. 1. 	Lynch 2010
2.04E-12	9-bp insertion	an insertion of 9 bp	rate of all (length 1 to 50) ins from p. 963 multiplied by the expected fraction of length 9, which is 0.0102 by the formula in Fig. 1. 	Lynch 2010
4.73E-13	36-bp insertion	an insertion of 36 bp	rate of all (length 1 to 50) ins from p. 963 multiplied by the expected fraction of length 36, which is 0.000815 by the formula in Fig. 1. 	Lynch 2010
Nice formatted version of table
| rate | label | description | comment | source |
| 1.20E-03 | STR repeat number | rate of repeat mutations | 91% are single-repeat changes | Weber and Wong 1993 |
| 1.00E-05 | DMD duplication | duplication of the Duchenne Muscular Dystrophy gene | this is a synthetic estimate based on data from refs 7 and 8 in source | van Ommen 2005 |
| 5.00E-06 | large-CNV exposure | the rate at which a nucleotide is included in a duplication | mid-point of range estimate of 16kb to 50kb per birth, divided by diploid genome size | Campbell and Eichler 2013 |
| 1.74E-07 | transition at CpG site | transition at CpG site is 15X the rate at other sites | attributed in source to refs 8, 21 | Lynch 2010 |
| 1.16E-08 | substitution | base substitution average per site per generation for autosomal | p. 961 | Lynch 2010 |
| 3.21E-10 | 1-bp deletion | a deletion of 1 bp | rate of all 1-50 dels from p. 963 multiplied by the expected fraction of length 1, which is 0.554 by the formula in Fig. 1. | Lynch 2010 |
| 1.11E-10 | 1-bp insertion | an insertion of 1 bp | rate of all 1-50 ins from p. 963 multiplied by the expected fraction of length 1, which is 0.554 by the formula in Fig. 1. | Lynch 2010 |
| 4.36E-11 | 3-bp deletion | a deletion of 3 bp | rate of all 1-50 dels from p. 963 multiplied by the expected fraction of length 3, which is 0.0751 by the formula in Fig. 1. | Lynch 2010 |
| 1.50E-11 | 3-bp insertion | an insertion of 3 bp | rate of all 1-50 ins from p. 963 multiplied by the expected fraction of length 3, which is 0.0751 by the formula in Fig. 1. | Lynch 2010 |
| 7.58E-12 | Alu insertion | average rate of Alu insertion per bp per generation | assuming 2 * 3.3e9 base pairs in genome | Cordaux et al. 2006 |
| 5.92E-12 | 9-bp deletion | a deletion of 9 bp | rate of all 1-50 dels from p. 963 multiplied by the expected fraction of length 9, which is 0.0102 by the formula in Fig. 1. | Lynch 2010 |
| 2.04E-12 | 9-bp insertion | an insertion of 9 bp | rate of all 1-50 ins from p. 963 multiplied by the expected fraction of length 9, which is 0.0102 by the formula in Fig. 1. | Lynch 2010 |
| 4.73E-13 | 36-bp insertion | an insertion of 36 bp | rate of all 1-50 ins from p. 963 multiplied by the expected fraction of length 36, which is 0.000815 by the formula in Fig. 1. | Lynch 2010 |
Footnotes
[1] The founders of population genetics actually formalized a binary view of mutation rates for the kinds of mutations that might be incorporated in evolution. There were “recurrent mutations”, reliably present in the gene pool, and non-recurrent mutations which could be ignored, on the grounds that selection never waits for a rare mutation, but evolution takes place on the basis of common variation abundantly “maintained” in the “gene pool”. The classical view was to imagine evolution as “shifting gene frequencies”, i.e., a process in which a population moves from one point to another in the interior of an allele-frequency space (i.e., all the alleles have non-zero frequencies). Once we are in the interior of the allele-frequency space, mutation rates don’t matter much because they are small relative to the effect of selection (or even drift), which is why mutation rates are left out of some classic work such as Lewontin & Kojima 1960. Of course, the founders developed some mathematical formalizations that include a continuous mutation rate, e.g., f = u/s for the equilibrium frequency of a deleterious allele in mutation-selection balance. However, that is a rate of deleterious mutation, treated as a mass-action force pushing on allele frequencies. The kind of rate that is generally missing from classical population genetics is a rate for the kind of mutations destined to be incorporated in evolution. This issue is reviewed briefly in McCandlish and Stoltzfus (2014).
[2] One might object to the choice of humans on the grounds that they have a relatively small historic population size, and that, for species with larger historic population sizes, we would expect the deleterious mutation rate to decrease, perhaps via eliminating mutations with high rates, like STR mutations. That may be a nice theory for organisms that live in constant environments and have exclusively vertical inheritance, but it doesn’t seem to have much effect on the upper range of mutation rates seen in E. coli, which has a large historic population size and is subject to various types of mutations with high rates, including (1) prophage excisions that take place spontaneously at a rate of about 10-3 per generation, (2) certain duplications and inversions, involving recombination between multiple copies of the rDNA operons, that happen at rates of 10-3 to 10-5, and (3) transposon jumps and deletions that take place at rates of about 10-5 per element. Note that the cost of a genomic mutation rate of U, as a reduction in fitness, is 1 – e-U, which is roughly equal to U for small values of U, and does not depend much on the distribution of effects (a lethal mutation results in 1 death immediately, and a mildly deleterious mutation results in the statistical equivalent of 1 death spread out over a long time; see Kimura and Maruyama, 1966). So, E. coli is metaphorically carrying a burden of s = 10-3 for each resident prophage.